
Dashboard
Transforms data from Security Gateway, Delta, Digital Maintenance Gateway and Echo into one clear operational picture of fleet status and security for customer teams and, where contracted, RazorSecure analysts.

What it does
Every RazorSecure product generates evidence: traffic crossing zones, anomalous system behaviour, maintenance activity, and changes in availability and configuration. Dashboard combines this data and presents insights that can be acted upon per fleet, vehicle and system.
Customer operations, maintainers and security teams can use Dashboard directly. RazorSecure analysts use it when an analyst-led managed service is supplied.
Key benefits
See your whole estate
An asset-centric view of system, device and network status, security and performance data without switching between separate tools.
Act faster
Alerts arrive with the context needed to triage: asset, zone, baseline deviation, history.
Evidence compliance
Reporting aligned to the frameworks your regulators ask about (CLC/TS 50701, IEC 62443, NIS2).
Supports customer and managed workflows
Use it with your own operational and security teams, or with RazorSecure analyst support where that service is contracted.
Key capabilities
Fleet & vehicle views
Drill down from an estate-wide level to a single device on a single unit.
Alert triage workflow
Delta anomalies managed with status, ownership and an audit trail.
Availability & configuration
Echo's near-real-time asset status alongside security events.
Network zone mapping
Security Gateway zones and traffic flows, visualised.
Reporting & export
Scheduled and on-demand reports for operations, engineering and compliance.
Secure access and deployment
Role-based access for operators, maintainers and OEM partners, with cloud or on-premises deployment agreed against architecture and data-residency requirements.
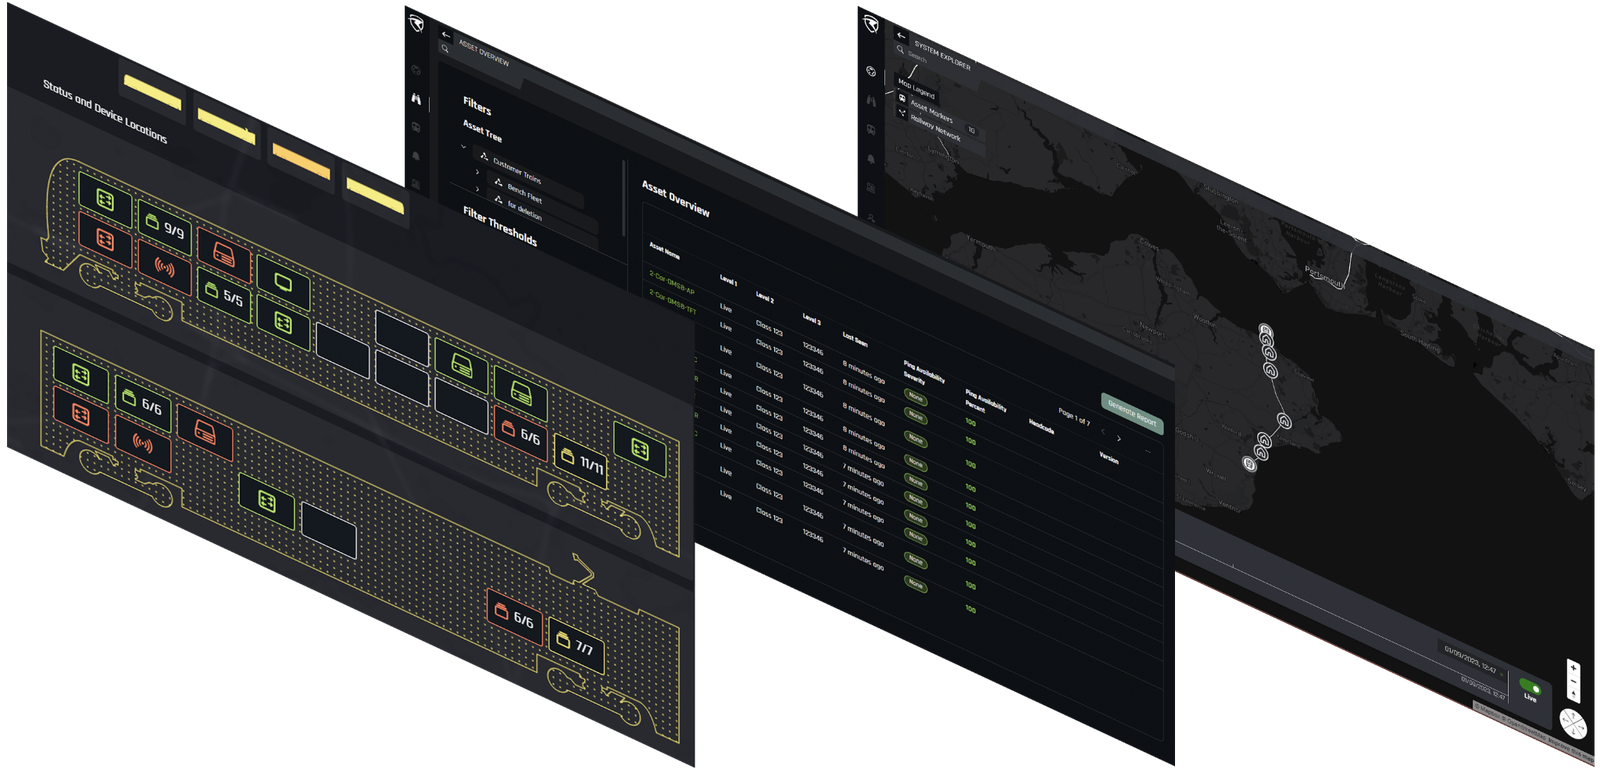
Operate from one picture
Dashboard is the operating layer of The Secure Train: alerts, asset state, baseline changes and evidence are brought together for customer operations, maintainers and security teams.
See the full architecturePlan your integration
See monitoring & lifecycle services for the managed monitoring service.
Request a technical workshopRelated products